WMO Air Quality and Climate Bulletin released for Clean Air Day
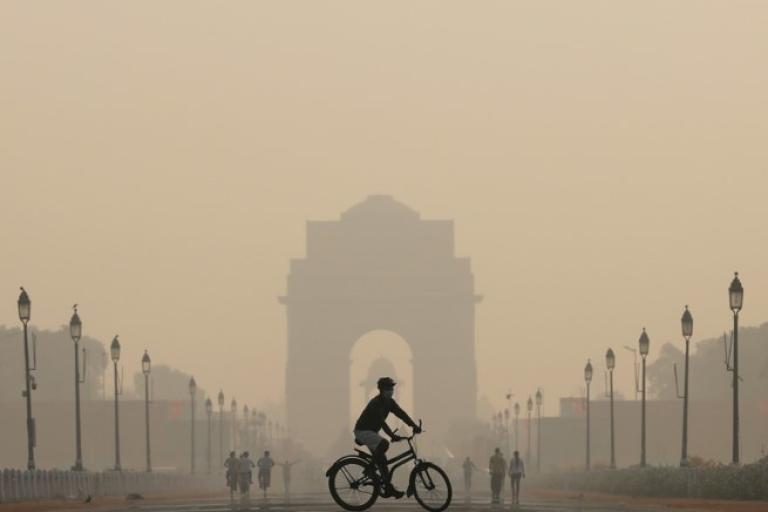
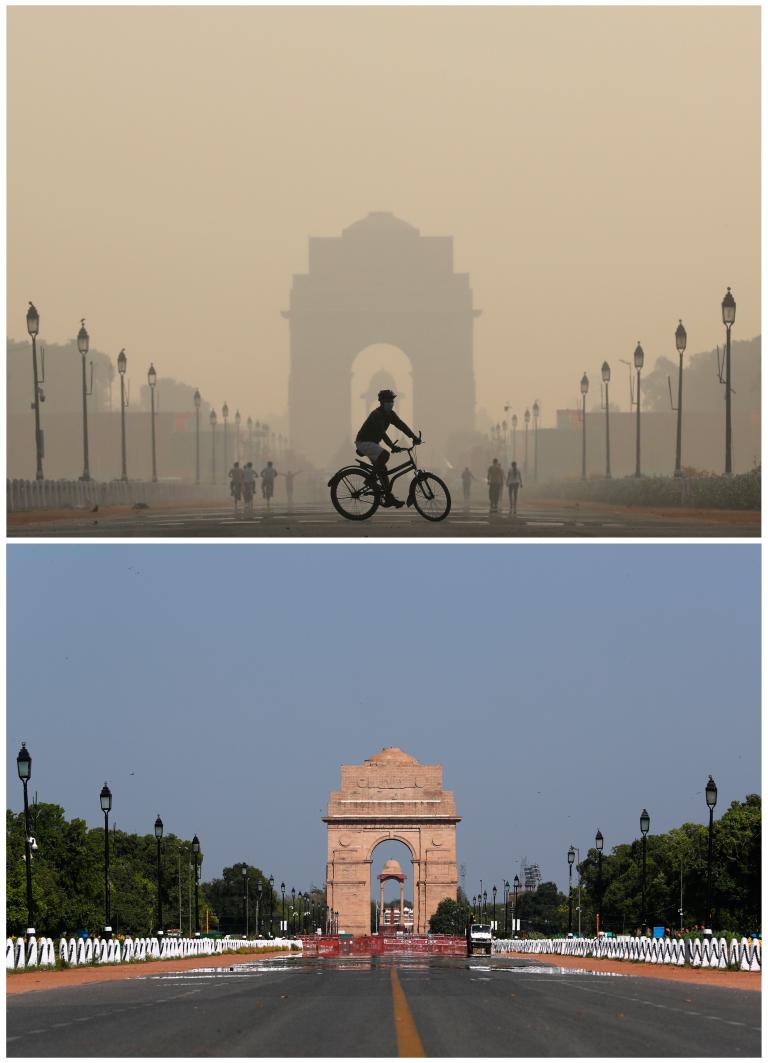
The COVID-19 lockdown and travel restrictions led to a dramatic short-lived fall in emissions of key air pollutants in 2020, especially in urban areas. Many city dwellers saw blue skies instead of the pollution cloud. But the reduction was not uniformly spread across all regions or all types of pollutants. And many parts of the world still fell short of air quality guidelines, according to a new report from the World Meteorological Organization, which was released for the International Day of Clean Air for Blue Skies on 7 September.
3 September 2021 (WMO) - The COVID-19 lockdown and travel restrictions led to a dramatic short-lived fall in emissions of key air pollutants in 2020, especially in urban areas. Many city dwellers saw blue skies instead of the pollution cloud. But the reduction was not uniformly spread across all regions or all types of pollutants. And many parts of the world still fell short of air quality guidelines, according to a new report from the World Meteorological Organization (WMO), which was , which was released for the International Day of Clean Air for Blue Skies on 7 September.
The Air Quality and Climate Bulletin – the first of its kind issued by WMO – highlights the main factors that influence air quality patterns in 2020, in comparison to other years. It shows how there were episodes of both improvement and deterioration of air quality in different parts of the world.
It demonstrates an intimate connection between air quality and climate change. While human-caused emissions of air pollutants fell during the COVID-19 economic turndown, meteorological extremes fuelled by climate and environmental change triggered unprecedented sand and dust storms and wildfires that affected air quality.
This trend is continuing in 2021. Devastating wildfires in North America, Europe and Siberia have affected air quality for millions, and sand and dust storms have blanketed many regions and travelled across continents.
“COVID-19 proved to be an unplanned air-quality experiment, and it did lead to temporary localized improvements. But a pandemic is not a substitute for sustained and systematic action to tackle major drivers of both pollution and climate change and so safeguard the health of both people and planet,” said WMO Secretary-General Prof. Petteri Taalas.
“The impacts of air pollutants occur near the surface, on timescales of days to weeks, and are usually localized. By contrast, ongoing climate change, caused by the accumulation of greenhouse gases in the atmosphere, is happening on a timescale of decades to centuries and is driving environmental changes worldwide. Despite the differences, we need a coherent and integrated air quality and climate policy based on observations and science,” he said.
Air pollution has significant impacts on human health. Estimates from the latest Global Burden of Disease assessment show that global mortality increased from 2.3 million in 1990 (91% due to particulate matter, 9% due to ozone) to 4.5 million in 2019 (92% due to particulate matter, 8% due to ozone), says the Bulletin.
The Bulletin and an accompanying animation was published ahead of International Day of Clean Air for Blue Skies on 7 September. This was established by the UN General Assembly to raise awareness and facilitate actions to improve air quality which is critical for human health and climate change mitigation.
The theme this year is Healthy Air, Healthy Planet.
"Today, as many as nine out of ten people breathe polluted air, leading to some 7 million premature deaths each year, of whom 600,000 are children. Unless we act decisively, this number could double by 2050," said UN Secretary-General António Guterres in a message.
"The pollution that is damaging our health is also driving the climate crisis. But air pollution can be solved. On the International Day of Clean Air for blue skies, I call on all countries to do more to improve air quality," he said.
"Better monitoring can identify sources of air pollution," said Mr Guterres.
Observations of the atmospheric chemical composition such as those coordinated by the Global Atmosphere Watch of WMO are indispensable to understand its state and the trend. They help to improve forecasting systems and support integrated air quality and climate policies.
The impact of COVID-19 on air quality
Many governments around the world responded to the COVID-19 pandemic by restricting gatherings, closing schools and imposing lockdowns. These stay-at-home policies led to an unprecedented decrease in pollutant emissions.
In areas such as China, Europe and North America, short-term COVID-related reductions in emissions coincided with long-term emission-mitigation measures that led to lower PM2.5 concentrations in 2020 compared to previous years. The increase in PM2.5 over India was less pronounced than in previous years.
However, some studies indicate that in many parts of the world, PM2.5 concentrations would be unlikely to meet World Health Organization guidelines, despite drastic reductions in mobility.
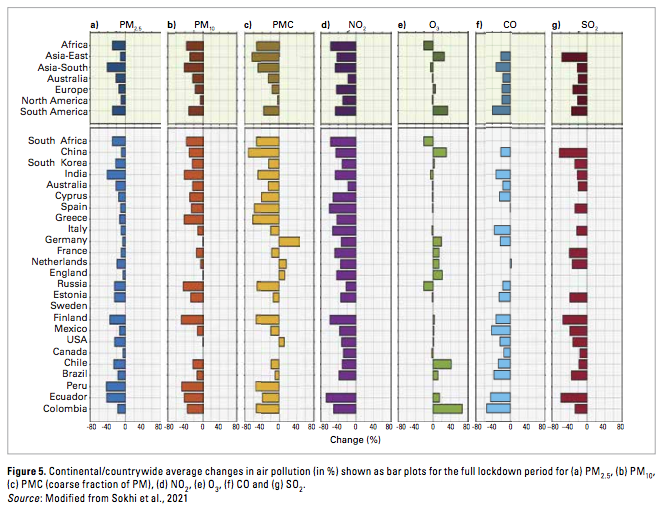
WMO/Global Atmosphere Watch programme examined the behaviour of key air-pollutants from over 540 traffic, background and rural stations, in and around 63 cities from 25 countries located in seven geographical regions of the world.
The data were used to analyse changes in air quality for the main pollutants, such as PM2.5, sulphur dioxide (SO2), nitrogen oxides (NOx), carbon monoxide (CO) and ozone (O3).
Analysis showed decreases of up to approximately 70% in mean NO2 and 30%–40% in mean PM2.5 concentrations during full lockdown in 2020 compared with the same periods in 2015–2019. PM2.5, however, exhibited complex behaviour even within the same region, with increases in some Spanish cities, for instance, which were attributed mainly to the long-range transport of African dust and/or biomass burning.
Changes in ozone concentrations varied greatly among regions, ranging from no overall change to small increases (as was the case for Europe) and larger increases (+25% in East Asia and +30% in South America).
SO2 concentrations were between ~25% to 60% lower in 2020 than during 2015–2019 for all regions. CO levels were lower for all regions, with the largest decrease for South America, of up to approximately 40%.
Climate, wildfires and air quality
Intense wildfires generated anomalously high PM2.5 concentrations in several parts of the world that were unusually dry and hot in 2020. In January and the preceding December, southwestern Australia was affected by widespread wildfires, which exacerbated air pollution.
Smoke from the Australian fires also led to temporary cooling across the southern hemisphere, comparable to that caused by ash from a volcanic eruption.
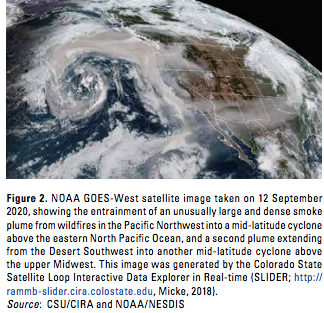
The 2020 wildfire season was marked by extreme fires in Siberia and the western United States, in terms of total pyrogenic carbon released into the atmosphere, with extremely dense and expansive smoke plumes visible from space. There was uncharacteristically weak fire activity in Alaska and Canada, compared with previous decades.
The NASA Global Modeling and Assimilation Office assessed the impact of the fires on outdoor air pollution across North America and estimated how many people were exposed to varying levels of pollutants. It found that the number of people who likely experienced unhealthy levels of air pollution increased during the fire season and peaked in the second week of September, when most of the intense fires occurred in the western United States. For more than a week, 20–50 million people – mostly in the western United States but also in regions downwind – were classified as having a “High” or “Very High” health risk.
Climate change policy
Human activities that release long-lived greenhouse gases into the atmosphere also enhance the concentrations of shorter-lived ozone and particulate matter in the atmosphere. For example, the combustion of fossil fuels (a major source of carbon dioxide (CO2)) also emits nitrogen oxide (NO) into the atmosphere, which can lead to the photochemical formation of ozone and nitrate aerosols. Similarly, agricultural activities (which are major sources of the greenhouse gas methane) emit ammonia, which then forms ammonium aerosols.
Traditional pollutants include short-lived reactive gases such as ozone – a trace gas that is both a common air pollutant and a greenhouse gas – and particulate matter – a wide range of tiny particles suspended in the atmosphere (commonly referred to as aerosols). Both are detrimental to human health and have complex characteristics, which can either cool or warm the atmosphere.
Policy changes that seek to improve air quality thus have repercussions on those policies that seek to limit climate change, and vice versa. For instance, a drastic reduction in fossil fuel combustion to reduce greenhouse gas emissions will also reduce air pollutants associated with that activity, such as ozone and nitrate aerosols.
Policies to reduce particulate matter pollution to protect human health may remove the cooling effect of sulfate aerosols or the warming effect of black carbon (soot particles).
Finally, changes in climate can influence pollution levels directly. For example, the increased frequency and intensity of heatwaves may lead to the additional accumulation of pollutants close to the surface. According to the recent Intergovernmental Panel on Climate Change report, the frequency and intensity of such events is going to increase in the future.
Notes for Editors
WMO wishes to thank the Bulletin Editorial Board and all contributors for their input.
This Bulletin contains contributions from the WMO/GAW Scientific Advisory Group on Aerosols, the Scientific Advisory Group on Applications, the Scientific Advisory Group for GAW Urban Research Meteorology and Environment, the Scientific Advisory Group for Reactive Gases and the Steering Committee of Global Air Quality Forecasting and Information System. GBD mortality estimates due to ambient and household air pollution can be downloaded from https://www. stateofglobalair.org/.
Data for aerosols and reactive gases collected within the GAW Programme with support from WMO Members and contributing networks are available from the World Data Centre for Aerosols and Reactive Gases, which is supported by the Norsk Institutt for Luftforskning, Norway. Carbon monoxide data are available from the World Data Centre for Greenhouse Gases, which is supported by the Japan Meteorological Agency. GAW stations are described in the GAW Station Information System (https://gawsis.meteoswiss.ch/), which is supported by MeteoSwiss. All data from the Copernicus Atmosphere Monitoring Service are freely available from the Atmosphere Data Store: https://ads.atmosphere.copernicus.eu.
The World Meteorological Organization is the United Nations System’s authoritative voice
on Weather, Climate and Water
For further information contact: Clare Nullis, media officer. Email cnullis@wmo.int. Cell 41797091397
The World Meteorological Organization (WMO) is a specialized agency of the United Nations responsible for promoting international cooperation in atmospheric science and meteorology.
WMO monitors weather, climate, and water resources and provides support to its Members in forecasting and disaster mitigation. The organization is committed to advancing scientific knowledge and improving public safety and well-being through its work.
For further information, please contact:
- Clare Nullis WMO media officer cnullis@wmo.int +41 79 709 13 97