跳到主要内容
  • عربي
  • 中文
  • English
  • Français
  • Русский
  • Español
World Meteorological Organization
天气
气候
水
搜索图标
活动
  • 所有活动
  • 项目
  • 可持续发展目标
  • 缔约方会议(COP)
  • 活动和会议
主题
  • 所有主题
新闻
  • 新闻门户网站
  • 媒体通稿
资源
  • 最新出版物
  • 文件
  • 出版物系列
  • 图书馆
  • MeteoWorld
  • WMO Bulletin
  • 视频
  • 故事地图
  • Fact Sheets
  • Dashboards
  • 照片集
  • Podcasts
  • Campaigns
全系统
  • WMO全系统
  • METEOTERM
  • EC-79
  • EC-78
  • SERCOM-3
  • INFCOM-3
关于WMO
  • 概述
  • 秘书处
  • 我们的职责
  • 治理
  • 区域
  • WMO会员
  • 联络办公室
  • Office of the Legal Counsel of the Secretary-General
  • Gender Equality
  • 伙伴关系
  • Resource Mobilization
  • IMO和WMO的历史
  • 财务和问责
  • 世界气象日
  • WMO大楼
  • Youth Engagement

面包屑

  1. 首页
  2. 巴林

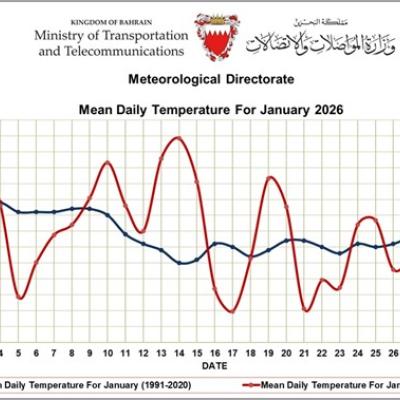
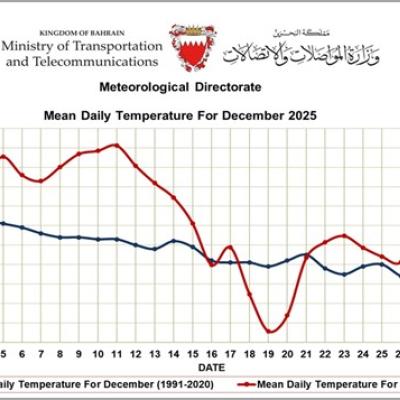
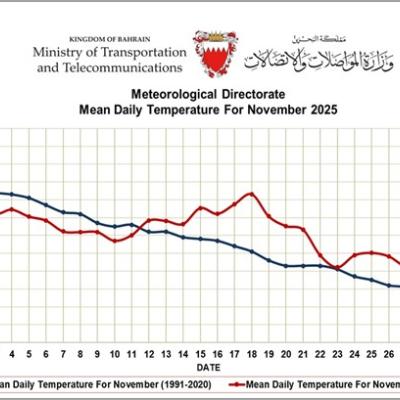
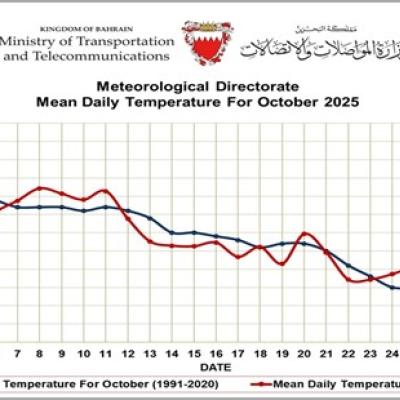
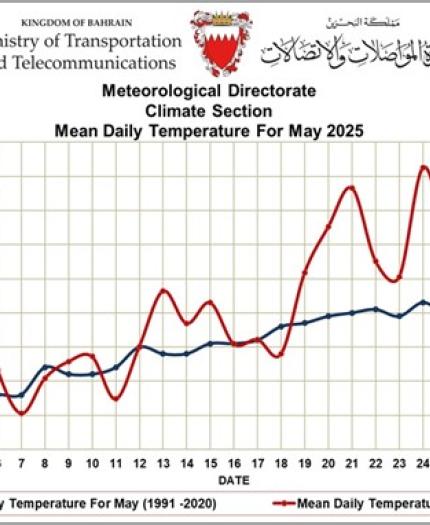
巴林

社区平台

国家概况数据库

当地气象服务

区域二:亚洲

News from 巴林

Line graph showing mean daily temperatures in Bahrain for May 2025 (red) compared to the historical average for May 1991–2020 (blue), with 2025 showing higher fluctuations.
2025年06月04日
Monthly Weather Summary - May 2025
Line graph comparing mean daily temperatures for April 2025 and April averages from 1991-2020 in Bahrain, showing higher and more variable temperatures in 2025.
2025年05月08日
Monthly Weather Summary - April 2025
Line graph showing mean daily temperatures for February 2025 and 1991-2020 in Bahrain. Temperatures fluctuate around 18-21°C, with a notable drop on the 28th in 2025.
2025年03月06日
Monthly Weather Summary - February 2025
Graph of mean daily temperatures in January 2025 from the Meteorological Directorate of Bahrain, comparing historical (1991-2020) data with projected data. Temperature in Celsius.
2025年02月11日
Monthly Weather Summary - January 2025
Line chart comparing mean daily temperatures in November 2024 (red) to historical data from 1991-2020 (blue) in Bahrain. The 2024 line shows higher temperatures overall.
2024年12月02日
Monthly Weather Summary - November 2024
Line graph showing mean daily temperatures in Bahrain for October 2024 (red), compared with 1991-2020 average (blue). The 2024 temperatures start higher and decline steadily, meeting the average at month's end.
2024年11月06日
Monthly Weather Summary - October 2024
Line graph of mean daily temperatures in Bahrain for September 2024, showing actual 2024 temperatures (red) compared with 1991-2020 average (blue). Data shows fluctuation in temperatures.
2024年10月11日
Monthly weather summary - September 2024
Graph from the Ministry of Transportation and Telecommunications in Bahrain showing mean daily temperatures for June 2024 against a historical average (1991-2020).
2024年08月05日
Monthly Weather Summary - July 2024
Graph showing the mean daily temperature in Bahrain for June 2024, with red and blue lines representing 2024 and 1991-2020 temperatures respectively. The 2024 line shows higher temperatures.
2024年07月04日
Monthly Weather Summary - June 2024
World Meteorological Organization
欢迎来到世界气象组织
WMO的工作
了解WMO的就业机会
WMO大楼
关于总部如何诞生的故事
采购
查看最新的招投标
奖项
WMO奖项表彰杰出贡献
联系我们
如何联系WMO
© 2025 世界气象组织(WMO)
版权
免责声明
隐私政策
举报欺诈、腐败或滥用职权